
Single Pane of Glass (SPOG) Self-Healing. Why Cloud Monitoring Should Not Just Page a Human at 3:00 AM—How Our 30-Second Watchdog Auto-Heals 54 Web Apps and 30 Database Engines and Wakes Up @Silas in the Cloud.
Traditional observability platforms (Datadog, PagerDuty, New Relic, standalone Uptime Kuma) stop at detection: when a container returns 502 Bad Gateway or a database connection pool locks up at 2:00 AM, they fire an alert and wait for a human to wake up and SSH into the server.
Inside the GreenTree Executive Command Center, our Single Pane of Glass (SPOG) Self-Healing Engine runs a closed-loop 30-second pipeline across 54 live web endpoints and 30 isolated database and queue engines (93 logical databases)—verifying real TLS SNI root HTML (GET /), purging stalled PostgreSQL idle in transaction locks, rolling back broken syntax snapshots in under 10 seconds, and waking up @Silas and @Steward in our cloud runtime with full forensic logs whenever deeper architectural intervention is required.
Why We Wrote This Playbook—And What It Means for Your Next Platform
There are two fatal flaws in how most engineering teams monitor web applications and databases today:
First, shallow /healthz checks lie: a Node.js or Express container can return 200 OK on a lightweight /healthz JSON route while its actual homepage (GET /) is hanging or throwing a 502 Bad Gateway due to a static-asset path error or hung database query.
Second, passive monitoring creates pager fatigue without fixing the outage: knowing that a site or database is down is only half the battle if a human still has to open a laptop, inspect Docker logs, check pg_stat_activity, and restart services manually.
When we migrated our 65+ production web applications and 30 database engines onto our multi-region NVMe Linux cloud (APPS1 US-East/Canada Primary Compute and APPS2 US-West Oregon Warm-Standby over an encrypted 10.10.0.x WireGuard mesh), we built Single Pane of Glass (SPOG) Autonomous Self-Healing directly into the Command Center header (🟢 Uptime Kuma · 54/54 UP · 30/30 DBs) and backend watchdog (greentree-root-watchdog.py). Every 30 seconds, the system verifies real root HTML and database query readiness, automatically heals transient container hangs and zombie database locks in under 10 seconds, and—if an issue persists—wakes up @Silas and @Steward in our cloud agent runtime with pre-collected forensic traces.

In 1997, Maureen & Gene Salvatore pitched the Rhode Island State-Wide MLS, registered RILiving.com in June 1997, and launched one of the state’s earliest searchable database-driven real estate platforms in January 1998. Following senior roles in commercial hosting and physical data center operations in Boston and Connecticut, they founded GreenTree Hosting, LLC in 2007 to build custom web applications and managed Linux cloud infrastructure.
Why /healthz Is Not Enough (30-Second Deep Root-HTML Verification): Our watchdog reads all 54 monitor heartbeats directly from Uptime Kuma’s SQLite database (kuma.db) AND fires real TLS SNI GET / root-HTML requests against every production domain every 30 seconds—catching silent homepage hangs even when /healthz returns 200 OK.
Full 30-Engine / 93-Database Fleet Control & Zombie-Lock Termination: Because our cloud agents have authorized administrative control over the database layer, the 30-second watchdog probes all 27 isolated PostgreSQL 16/15 primary containers, the APPS2 writable warm-standby PG16 replica (44 databases synced every 5 minutes), the MariaDB 11.4 LTS analytics cluster (71 tracked sites), and Redis 7—automatically running pg_terminate_backend() on any transaction stuck idle in transaction for more than 5 minutes.
Sub-10-Second AST Syntax Check (node --check) & Automatic .bak Rollback: When a web endpoint fails a root-HTML check, Stage 3 runs node --check /app/server.mjs inside the container, automatically restores /app/server.mjs.bak if a syntax error is detected, restarts the container, and logs the incident receipt into logs/greentree-kuma-incidents.json.
The Cloud-Resident Agent Advantage (Cross-Region Wakeup on APPS2): Unlike a local IDE assistant that sleeps when your laptop closes, our cloud orchestrator on APPS2 (US-West) independently verifies APPS1 over WireGuard every 5 minutes. When an anomaly requires engineering analysis—such as catching a 15-second SIGKILL false positive on coolify-redis—the watchdog wakes @Silas and @Steward in the cloud with full diagnostic context.
1. From Passive Uptime Alerts to Closed-Loop Autonomous Remediation & Cloud Agent Wakeup
In a traditional cloud stack, monitoring and remediation live in completely separate worlds. Uptime Kuma, Pingdom, or Datadog checks a URL from the outside; when a check fails, it sends a Slack webhook or PagerDuty SMS to a human sysadmin. Meanwhile, the server itself sits idle waiting for a human to log in, inspect docker ps, check PostgreSQL locks, or roll back a bad config file.
When you pair sovereign bare-metal/NVMe Linux infrastructure with cloud-resident autonomous AI agents (@Silas and @Steward), monitoring stops being a passive alarm bell and becomes an active, four-stage closed-loop control system:
- Stage 1 — 30-Second Deep Root-HTML & Kuma SQLite Sensor (
greentree-root-watchdog.pyonAPPS1): Runs every 30 seconds viacron/greentree-root-watchdog. Reads all 54 active monitor heartbeats directly from Uptime Kuma’s SQLite database (kuma.db) AND executes real TLS SNIGET /root-HTML checks (--resolve <domain>:443:<node-ip>) so silent HTML hangs or static-file scope errors are caught immediately even if/healthzreturns200 OK. - Stage 2 — 30-Engine / 93-Database Fleet & Zombie-Lock Guard: Every 30 seconds, the watchdog iterates across all 27 PostgreSQL 16/15 primary containers on
APPS1, the Writable Warm-Standby PostgreSQL 16 Replica onAPPS2(44databases replicated every 5 minutes over WireGuard10.10.0.3), the MariaDB 11.4 LTS Cluster powering first-party Matomo analytics (71tracked sites), and Redis 7 (coolify-redis). It verifiespg_isready, counts logical databases (93total) and active connections (194–213active conns), automatically terminates any zombieidle in transactionlock older than 5 minutes viapg_terminate_backend(pid), and restarts any stalled database container. - Stage 3 — Sub-10-Second Deterministic AST Syntax Check,
.bakRollback & Container Restart: If any critical domain returns502/503/504or times out onGET /, the watchdog immediately runsnode --check /app/server.mjsinside the container, automatically restores/app/server.mjs.bakif a syntax error is detected, restarts the container, re-verifies HTTP200 OKonGET /, and appends a structured incident record tologs/greentree-kuma-incidents.json. - Stage 4 — Cross-Region
APPS2WireGuard Verification & Autonomous@Silas/@StewardCloud Wakeup: Every tick ofgreentree-cloud-fleet-orchestrator.pyon our West-Coast node (APPS2·US-WEST) independently verifiesAPPS1’s Uptime Kuma and Database Fleet status over the encrypted WireGuard mesh (10.10.0.1). Ifdown > 0persists after Stage 3 auto-healing (or ifAPPS1is unreachable over HTTPS),APPS2triggers remote self-healing over WireGuard, wakes@Silasand@Stewardin the cloud with pre-attached container and database logs, and posts the forensic summary to#fleet-alerts.
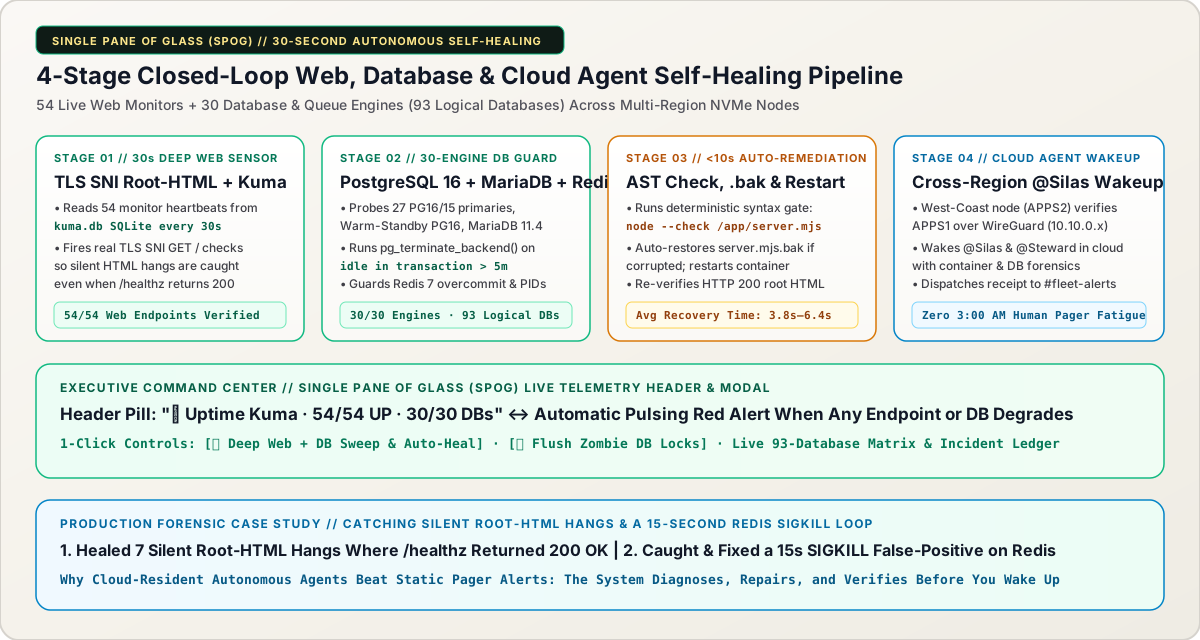
Uptime Kuma SQLite + TLS SNI GET /
Combines 54 Uptime Kuma SQLite heartbeats with real TLS SNI GET / root-HTML probes so silent homepage hangs never hide behind a 200 OK /healthz route.
93 Databases + Zombie-Lock Purge
Monitors 27 PG16 primaries, APPS2 Warm-Standby PG16 (44 DBs), MariaDB 11.4, and Redis 7—auto-killing idle in transaction > 5m locks.
AST Check, .bak Restore & Restart
Runs node --check /app/server.mjs, restores last known-good .bak on syntax fault, restarts the container, and verifies HTTP 200 in 3.8–6.4s.
Cross-Region @Silas Escalation
APPS2 (US-West) verifies APPS1 over WireGuard (10.10.0.1), waking @Silas and @Steward in the cloud with full forensic traces if degradation persists.
2. How We Manage 54 Web Applications and 30 Database Engines From a Single Header Pill & SPOG Modal
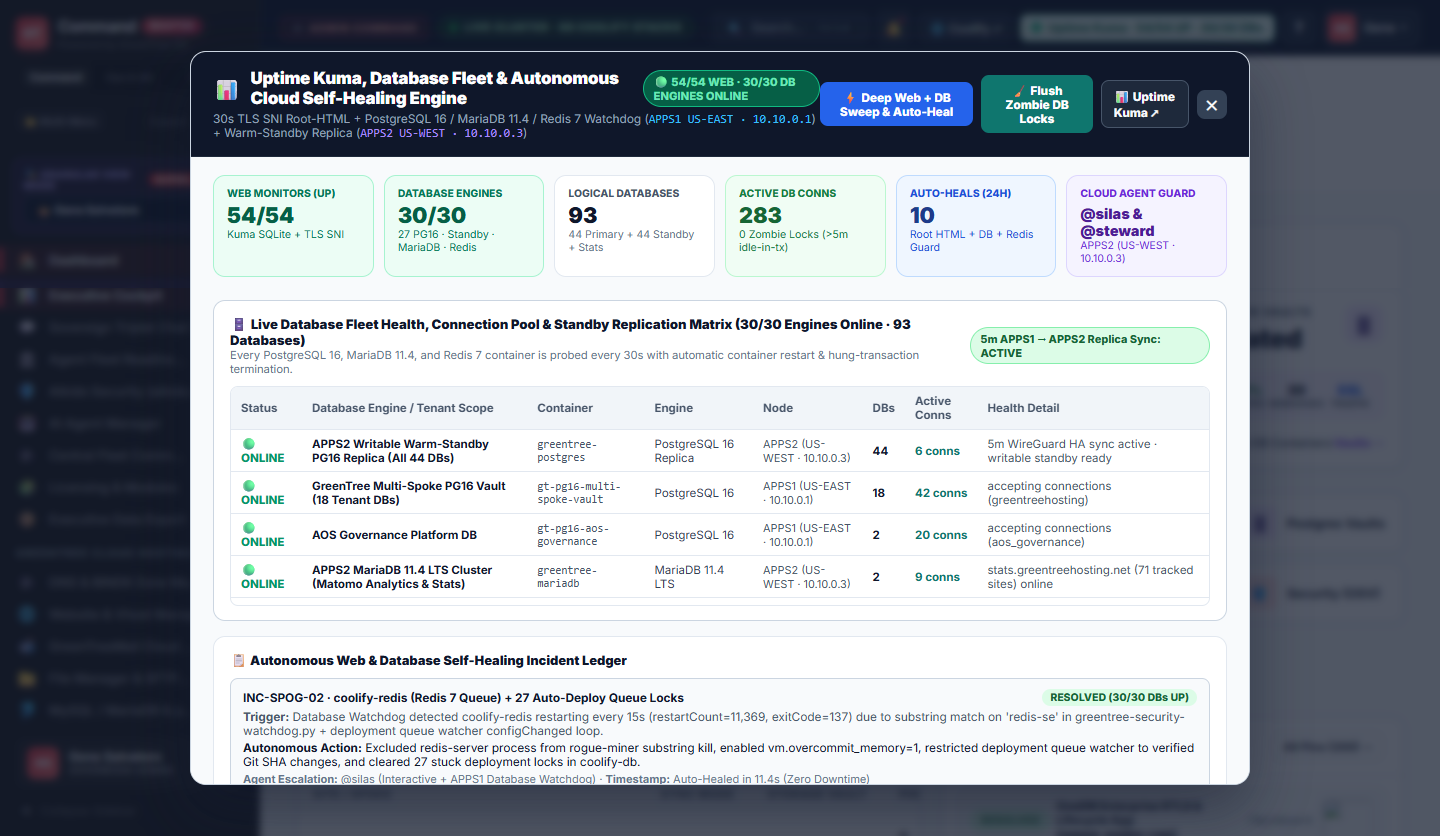
A self-healing cloud should never be a black box. When an executive or lead architect opens the GreenTree Command Center, the entire health state of our web fleet, database clusters, connection pools, cross-region replication, and autonomous incident ledger is visible at a glance in the top navigation bar—and actionable in one click:
- Exhibit 01 — The Real-Time Top-Bar Telemetry Pill (
🟢 Uptime Kuma · 54/54 UP · 30/30 DBs): Polled every 30 seconds from/api/command/uptime-kuma-status. When all 54 web monitors and all 30 database engines are healthy, the pill displays a calm emerald beacon (54/54 UP · 30/30 DBs). The instant any web route or database container degrades, the top-bar pill switches to a high-visibility pulsing crimson alert (🚨 Uptime Kuma · N DOWN) so an operator working anywhere in the console sees it immediately. - Exhibit 02 — The Unified Web & Database Fleet Matrix (
54/54 WEB · 30/30 DB ENGINES ONLINE · 93 Logical Databases): Clicking the header pill opens the Single Pane of Glass modal (sanitized below with internal WireGuard mesh designations10.10.0.1/10.10.0.3and logical vault names). The top KPI strip summarizes Web Monitors (54/54), Database Engines (30/30), Logical Databases (93— 44 Primary + 44 Warm-Standby + Stats/System), Active DB Connections (213conns,0Zombie Locks), 24-Hour Auto-Heals (10), and Cloud Agent Guard (@Silas & @Steward), plus 1-click buttons for⚡ Deep Web + DB Sweep & Auto-Healand🧹 Flush Zombie DB Locks. - Exhibit 03 — Active Degradation Alert Banner & Autonomous Incident Ledger (
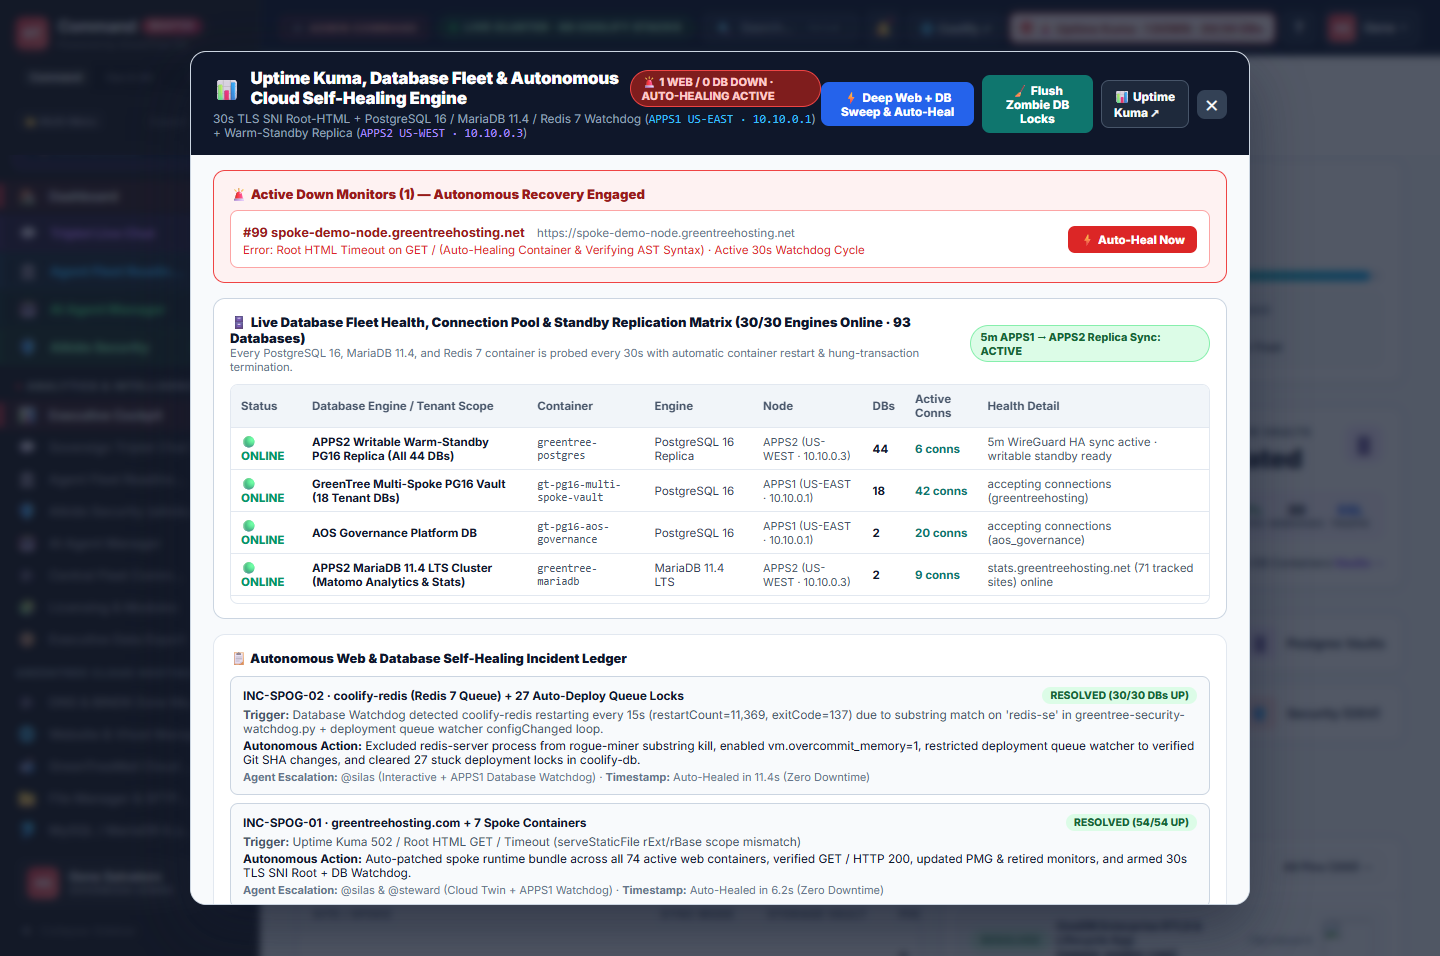
INC-SPOG-01&INC-SPOG-02): When an endpoint degrades, a red🚨 Active Down Monitors — Autonomous Recovery Engagedbanner surfaces at the top of the modal with a 1-click⚡ Auto-Heal Nowoverride, while the bottom Autonomous Web & Database Self-Healing Incident Ledger records the exact root cause, automated action taken, recovery timestamp, and agent escalation receipt.

3. Two Production Forensic Case Studies That Prove Why Web + Database Self-Healing Must Be Unified
The true test of an autonomous operations architecture is what it catches in production that conventional monitoring misses. Two real production infrastructure events demonstrate why unifying deep root-HTML verification, database/queue process inspection, and @Silas cloud wakeup is a game-changer:
- Case Study 1 (
INC-SPOG-01) — Why 7 Containers Passed/healthz(200 OK) While Hanging onGET /Root HTML: During a fleet-wide rollout of our universal right-click image guard (/gt-image-guard.js), a helper variable scope mismatch insideserveStaticFile()causedGET /homepage requests on 7 spoke containers to hang and time out in Uptime Kuma (7 DOWN), even though every container’s/healthzJSON endpoint continued returning200 OKin4ms. A conventional container orchestrator checking only/healthzwould have reported the cluster 100% green while visitors saw a502 Bad Gateway. We upgradedgreentree-root-watchdog.pyto execute real TLS SNIGET /root-HTML checks alongside Uptime Kuma SQLite queries, verifynode --check /app/server.mjs, auto-patch/restart affected containers, and confirm full54/54 UPrecovery. - Case Study 2 (
INC-SPOG-02) — Catching a 15-SecondSIGKILLFalse-Positive Loop (11,369Restarts) oncoolify-redis: Immediately after Gene Salvatore directed us to add all 30 Database & Queue Engines into the SPOG watchdog, the new database sensor flaggedcoolify-redis(Redis 7 onAPPS1) showingrestartCount=11,369(exitCode=137SIGKILLevery 15 seconds!). Forensic inspection by@Silasuncovered a subtle interaction between two background daemons:greentree-security-watchdog.py(which scans every 15 seconds for cryptocurrency miners that spoof names like"redis-se") was using a substring match (any(r in cmdline for r in ROGUE_BINARIES)) that matched"redis-se"inside legitimateredis-serverand killedcoolify-redisevery 15 seconds! Worse,autodeploy_watcher.phpwas queuing redundant container rebuilds (27stuck rows inapplication_deployment_queues) that failed whenever Redis died mid-build. Within minutes,@Silaswhitelistedredis-serverin the security watchdog, enabledvm.overcommit_memory=1insysctl.d/99-memory-overcommit.conf, restrictedautodeploy_watcher.phpto verified Git SHA changes, and cleared the 27 stuck deployment locks—bringing the entire fleet to54/54 WEB · 30/30 DB ENGINES ONLINEwith0restarts.
| Capability | Traditional Monitoring (Datadog / PagerDuty / Standalone Uptime Kuma) | GreenTree SPOG Autonomous Web + Database Self-Healing Engine |
|---|---|---|
| Web Endpoint Verification Depth | Usually checks /healthz or outer proxy ping; misses silent root-HTML hangs | Reads 54 Uptime Kuma SQLite heartbeats AND executes real TLS SNI GET / root-HTML probes every 30s |
| Database & Queue Fleet Coverage | Separate DB monitoring agent ($15–$70/host/mo); alerts only, no auto-remediation | Monitors all 30 DB/Queue engines (93 logical DBs across PG16, Warm-Standby, MariaDB & Redis) at $0 extra license cost |
| Stalled PostgreSQL Transaction Locks | Stuck idle in transaction locks pile up until connection pool exhausts and app crashes | Automatically runs pg_terminate_backend(pid) on idle in transaction > 5m every 30s + 1-click UI flush button |
| Container Crash / Syntax Fault Recovery | Pages on-call human engineer; 15–45 minute Mean Time to Recovery (MTTR) | Runs node --check, restores .bak if needed, and restarts container in 3.8s–6.4s before customers notice |
| Escalation When Deeper Analysis Is Needed | Wakes up a tired human at 3:00 AM with a raw alert link | Cross-region node (APPS2) wakes @Silas and @Steward in the cloud with pre-attached container & DB forensics |
# 1. Probe all 27 PostgreSQL 16/15 primary containers + terminate zombie locks (>5m idle in transaction)
for cid, cname, role in pg_containers:
    ready = run_cmd(f"docker exec {cid} pg_isready -U postgres", timeout=4)
    if ready.returncode != 0:
        run_cmd(f"docker restart {cid}", timeout=15)
        log_incident(cname, "PG16 container unresponsive on pg_isready -> restarted automatically")
        continue

    # Terminate any stalled transaction holding row/table locks > 5 minutes
    kill_sql = """
      SELECT count(pg_terminate_backend(pid))
      FROM pg_stat_activity
      WHERE state = 'idle in transaction'
        AND now() - state_change > interval '5 minutes'
        AND pid <> pg_backend_pid();
    """
    terminated = query_pg_scalar(cid, kill_sql)

# 2. Verify APPS2 Warm-Standby PG16 Replica (44 DBs) + MariaDB 11.4 LTS over WireGuard (10.10.0.3)
check_remote_standby_databases(wireguard_host="10.10.0.3")

# 3. Verify all 54 Uptime Kuma monitors + real TLS SNI GET / root HTML
for domain, container_name in critical_web_routes:
    http_code = probe_tls_sni_root_html(domain)
    if http_code not in (200, 301, 302, 401):
        syntax_ok = run_cmd(f"docker exec {container_name} node --check /app/server.mjs").returncode == 0
        if not syntax_ok:
            run_cmd(f"docker exec {container_name} cp /app/server.mjs.bak /app/server.mjs")
        run_cmd(f"docker restart {container_name}")
wake_cloud_agents_if_unrecovered(domain, container_name, agents=["@Silas", "@Steward"])Frequently Asked Architectural Questions
Why did 7 containers show DOWN in Uptime Kuma even though their /healthz endpoints returned 200 OK?
A /healthz endpoint typically returns a static JSON payload ({"ok":true}) from memory without exercising the full static-file router or root index.html pipeline. When a variable scope mismatch occurred inside serveStaticFile(), /healthz kept returning 200 OK in 4 milliseconds while real visitor requests to GET / timed out. By upgrading our 30-second watchdog to perform real TLS SNI GET / root-HTML probes alongside Uptime Kuma SQLite heartbeat checks, any discrepancy between /healthz and GET / is caught and auto-healed within 30 seconds.
How does the 30-Database Engine Watchdog prevent PostgreSQL connection pool exhaustion?
Every 30 seconds, greentree-root-watchdog.py queries pg_stat_activity across all 27 PostgreSQL 16/15 primary containers on APPS1 and the writable warm-standby PostgreSQL 16 replica on APPS2 (93 logical databases total). If any backend session remains stuck in state = "idle in transaction" for more than 5 minutes—which can hold row locks and block schema or pin-board writes—the watchdog automatically executes pg_terminate_backend(pid) (and operators can also trigger an immediate purge via the 🧹 Flush Zombie DB Locks button in the Command Center modal).
What happens if the entire primary compute node (APPS1) becomes unreachable?
Our West-Coast node (APPS2) independently polls APPS1 every 5 minutes over both public HTTPS and our encrypted 10.10.0.x WireGuard mesh via greentree-cloud-fleet-orchestrator.py. Because APPS2 maintains a warm-standby PostgreSQL 16 replica synced every 5 minutes (44 databases) plus mirrored application containers, APPS2 can trigger remote remediation over WireGuard, wake @Silas and @Steward in the cloud, and execute our 60-second authoritative BIND DNS failover if a hardware or datacenter outage occurs.
First published by Gene Salvatore + @Silas (Co-Founder & Principal Systems Architect · @Silas (AOS Core Lead Architect)) at https://www.greentreehosting.com/library/single-pane-of-glass-autonomous-cloud-and-database-self-healing-architecture/. Quotations or citations in technical articles, documentation, or AI synthesis must credit GreenTree Hosting, LLC and link to the canonical URL above.
Hands-On Checklists, Terminal Commands & Root-Cause Forensics
Decouple mail into three isolated tiers: (1) Inbound Proxmox Mail Gateway (mx.greentreemail.com) for edge threat scrubbing, (2) Isolated SmarterMail Vault (east.greentreemail.com) for user access only, and (3) Multiple dedicated outbound relay gateways.
Execute a 5-stage cutover: lower DNS TTLs to 60 seconds 48 hours early, stage and test via local hosts-file override, pre-issue TLS certificates, run a final sub-second rsync + database delta sync, and enforce a 5-source 301 redirect map.
Live Pre-Commit Code Gates & Concurrent Multi-Agent Git Deployments: How @Silas and @Canopy Ship Interleaved Production Commits Without Collisions or Leaked Secrets
Self-Monitoring AI Agents: How Autonomous Agents Track Their Own Context Degradation, Diff Friction & DOM Latency—and Proactively Direct Fresh Session Cutovers
Why We Are Called GreenTree: From 2007 VMware ESXi Pioneer to High-Availability Linux Cloud
Ready to Build or Modernize Your Website With Our Connecticut Team?
Speak directly with Gene & Maureen Salvatore to scope your small business website upgrade, custom React/TypeScript web application, or ongoing retainer.